- Safety & Recalls
- Regulatory Updates
- Drug Coverage
- COPD
- Cardiovascular
- Obstetrics-Gynecology & Women's Health
- Ophthalmology
- Clinical Pharmacology
- Pediatrics
- Urology
- Pharmacy
- Idiopathic Pulmonary Fibrosis
- Diabetes and Endocrinology
- Allergy, Immunology, and ENT
- Musculoskeletal/Rheumatology
- Respiratory
- Psychiatry and Behavioral Health
- Dermatology
- Oncology
The use of antibiotic pharmacodynamic end points in incremental cost-effectiveness analyses: A novel approach for consideration during hospital formulary reviews
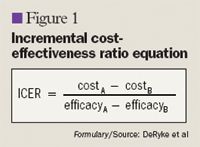
We propose using the results of pharmacodynamic Monte Carlo simulation studies as a surrogate marker for potential efficacy of antibiotic dosage regimens and applying these end points to the calculation of an incremental cost-effectiveness ratio (ICER).


Key Points
• Abstract
Hospital formulary decisions regarding antibiotics are typically made based on the comparative efficacy, safety, and pricing of these agents. Comparative efficacy studies, when available, usually demonstrate equivalence of antibiotics, making it difficult for formulary decision-makers to compare compounds. We propose using the results of pharmacodynamic Monte Carlo simulation studies as a surrogate marker for potential efficacy of antibiotic dosage regimens and applying these end points to the calculation of an incremental cost-effectiveness ratio (ICER). Monte Carlo simulation studies consider the antibiotic dosage regimen used, the drug's pharmacokinetics, and the level of susceptibility or resistance of targeted bacteria to arrive at a cumulative fraction of response (CFR), the probability that a specific antibiotic dosage regimen will achieve bactericidal pharmacodynamic exposures against the bacterial population of interest. It is assumed that the ability to obtain this exposure will result in a positive clinical response. In this article, we present examples of applying CFR during ICER analyses to compare cefepime with ceftazidime and meropenem with imipenem against Pseudomonas aeruginosa. In the absence of comparative clinical trial data, incorporation of pharmacodynamic surrogate markers to calculate the ICER can serve as a useful tool to pharmacy and therapeutics (P&T) committees during the formulary review process. (Formulary. 2007;42:252–260.)
Pharmacoeconomic analyses are useful in measuring the relevant costs and consequences of competing drug regimens in order to support formulary decision-making. Cost-effective analysis, and specifically the incremental cost-effectiveness ratio (ICER), is a particularly useful type of pharmacoeconomic analysis because it determines the monetary cost that would be incurred to obtain 1 additional unit of measure (eg, how much more is spent to achieve 1 additional cure) with a more expensive, but more effective, drug.1 Efficacy data used in these pharmacoeconomic analyses have commonly been derived from clinical trial data, which represent the percentage of patients achieving a positive clinical or microbiological outcome. However, for the purpose of assessing comparative efficacy of drugs during the formulary review, the use of clinical trial data may not be ideal because many of these manufacturer-sponsored studies are designed to show noninferiority of an agent, leading to statistically similar outcomes for the agent and the comparator. Additionally, in studies of antimicrobial agents, resistant organisms often are excluded, as the tested antibiotic regimens would not be expected to adequately respond to these organisms.
We propose that CFR might be useful as a surrogate marker for comparing potential clinical responses among antibiotics, as numerous animal, in vitro, and human clinical studies have demonstrated strong associations between PD exposures and the ability to kill bacteria, prevent mortality, or achieve a clinical response.2–5,9,10 In a single clinical study, CFR was predictive of clinical success for the treatment of complicated skin and skin structure infections.11 The use of CFR specifically in a cost-effectiveness analysis for formulary consideration also has been previously described; however, the authors did not apply common pharmacoeconomic methods, nor did they calculate the ICER.12 We propose that CFR obtained from PD modeling may be used as a surrogate marker for comparative efficacy when determining the ICER, and we provide examples of an assessment comparing the cephalosporins cefepime versus ceftazidime and the carbapenems meropenem versus imipenem for the treatment of Pseudomonas aeruginosa infections. We believe application of institution-specific data to this type of analysis could ultimately provide a useful tool for pharmacy and therapeutics (P&T) committees during the formulary decision-making process.
METHODS
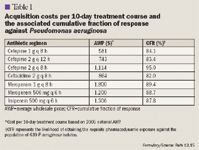
Our study analyzed cefepime versus ceftazidime and meropenem versus imipenem against a P aeruginosa population. The specific antipseudomonal regimens compared were cefepime 1 g every 8 hours, cefepime 2 g every 12 hours, or cefepime 2 g every 8 hours versus ceftazidime 2 g every 8 hours, and meropenem 1 g every 8 hours or meropenem 500 mg every 6 hours versus imipenem 500 mg every 6 hours. These antipseudomonal dosage regimens represent dosages (unadjusted for renal dysfunction) that are approved by FDA (cefepime, ceftazidime, imipenem, and meropenem 1 g every 8 hours) or are otherwise commonly used at many hospitals, including our institution (meropenem 500 mg every 6 hours). For this study, the cost of each drug regimen, assuming a 10-day course of treatment, was calculated using the national average wholesale price (AWP) from the 2005 Red Book.13 Ideally, institution-specific contract pricing and institution-specific average duration of treatment should be used during an institution's formulary review.
Microbiology. For institution-specific analyses, the use of local MIC distribution data for the P aeruginosa population would be ideal. However, as most hospitals do not have access to actual MIC distribution data (only percent susceptibility data), national surveillance data may be used as a suitable alternative if the susceptibility rates in the surveillance study are similar to those observed in the specific institution. For this study, we extrapolated the antibiotic MIC distributions from the North American portion of the 2004 Meropenem Yearly Susceptibility Test Information Collection (MYSTIC) surveillance study.14 MYSTIC contains a large set of data on nosocomial isolates from around the world and associated information on the MICs for these isolates. This global, multicenter surveillance study compared the activity of meropenem against Gram-positive and Gram-negative nosocomial isolates in high prescribing centers with the activity of imipenem, ertapenem, ceftazidime, cefepime, piperacillin/tazobactam, aztreonam, ceftriaxone, ciprofloxacin, and levofloxacin. Fourteen institutions geographically distributed throughout the United States provided 639 consecutive nonduplicate P aeruginosa isolates for MIC assessment. These institutions were primarily university teaching hospitals located in Arkansas, California, Colorado, Delaware, Iowa, Kentucky, Louisiana, Nebraska, New York, Ohio, Tennessee, Texas, and Utah. All isolates were derived from infected patients in the ICU. The percent susceptibilities for cefepime, ceftazidime, meropenem, and imipenem were 82.2%, 82.3%, 90.1%, and 87.5%, respectively.
Calculation of CFR. Because antibiotic efficacy results are not available for these cephalosporin and carbapenem drug regimens against this population of P aeruginosa, a PD end point (ie, CFR) was used as a surrogate marker of potential comparative efficacy. CFR for each proposed antibiotic regimen had been calculated previously using Monte Carlo simulation.15 Briefly, a 5,000-patient Monte Carlo simulation (Crystal Ball 2000 Professional, Decisioneering, Inc, Denver, Colo) was conducted to calculate estimates of fT>MIC for each antibiotic regimen against the P aeruginosa population. Pharmacokinetics was assumed to follow a 1-compartment model with a 0.5-hour infusion. Estimates of total body clearance and volume of distribution for each drug were extrapolated from published studies in healthy volunteers so that drugs could be compared equally.15 During each iteration, possible values for total body clearance, volume of distribution, the unbound fraction of drug, and MIC were substituted into the 1-compartment equation based on the probability distributions for each, thereby resulting in 5,000 different PD exposures for each antibiotic regimen. For the cephalosporins, targeted PD exposure was ≥50% fT>MIC, as this is commonly referenced as the exposure needed for maximal bactericidal effects.3–5 For the carbapenems, maximum bactericidal effects were observed with ≥40% fT>MIC.3–5 These data were used to calculate the number of patients who achieved these exposures throughout the 5,000 simulations. This proportion multiplied by 100 equals CFR, the likelihood of achieving each drug's required PD exposure. CFR was used in the cost-effectiveness analysis as an estimate for microbiological efficacy, assuming treatment of 100 consecutive patients. For example, a CFR of 90% meant 90 of 100 treated patients would achieve the bactericidal PD exposure with the respective dosage regimen.


Sensitivity analyses. Sensitivity analyses were conducted during the pharmacoeconomic analyses to test the robustness of the findings across possible situations (eg, changes in contract pricing). Multiple 1-way sensitivity analyses were performed by entering the base cost of each drug (the AWP) into Crystal Ball and altering this cost by ±20% to determine the effect on the resultant ICER.
RESULTS


Coalition promotes important acetaminophen dosing reminders
November 18th 2014It may come as a surprise that each year Americans catch approximately 1 billion colds, and the Centers for Disease Control and Prevention estimates that as many as 20% get the flu. This cold and flu season, 7 in 10 patients will reach for an over-the-counter (OTC) medicine to treat their coughs, stuffy noses, and sniffles. It’s an important time of the year to remind patients to double check their medicine labels so they don’t double up on medicines containing acetaminophen.
Support consumer access to specialty medications through value-based insurance design
June 30th 2014The driving force behind consumer cost-sharing provisions for specialty medications is the acquisition cost and not clinical value. This appears to be true for almost all public and private health plans, says a new report from researchers at the University of Michigan Center for Value-Based Insurance Design (V-BID Center) and the National Pharmaceutical Council (NPC).
Management of antipsychotic medication polypharmacy
June 13th 2013Within our healthcare-driven society, the increase in the identification and diagnosis of mental illnesses has led to a proportional increase in the prescribing of psychotropic medications. The prevalence of mental illnesses and subsequent treatment approaches may employ monotherapy as first-line treatment, but in many cases the use of combination of therapy can occur, leading to polypharmacy.1 Polypharmacy can be defined in several ways but it generally recognized as the use of multiple medications by one patient and the most common definition is the concurrent use of five more medications. The presence of polyharmacy has the potential to contribute to non-compliance, drug-drug interactions, medication errors, adverse events, or poor quality of life.
Medical innovation improves outcomes
June 12th 2013I have been diagnosed with stage 4 cancer of the pancreas, a disease that’s long been considered not just incurable, but almost impossible to treat-a recalcitrant disease that some practitioners feel has given oncology a bad name. I was told my life would be measured in weeks.